Support:Documents:Examples:Estimate Input Parameters, Rate Constants Known
Here we assume that the input function has the form
Cp = (p1t - p2 - p3) exp(-p4t) + p2 exp(-p5t) + p3 exp(-p6t)
where Cp is the plasma concentration of 18FDG, pi are the input function parameters to be estimated, and t is time. (This form comes from Feng, Huang, Wang. "Models for Computer simulation Studies of Input Functions for Tracer Kinetic Modeling with Positron Emission Tomography", International Journal of Biomedical Computing, 32(2):95-110, March 1993.)
Step 1 To set this up in MATLAB for simulation, create the following function and put it in a file called refCp.m:
function [fval, jac] = refCp(p, t)
 if (nargout > 0),
       t = t(:);  % make it a column vector
       fval = (p(1)*t - p(2) - p(3)) .* exp(-p(4)*t) + p(2) * exp(-p(5)*t) + p(3) * exp(-p(6)*t);
       if (nargout > 1),
           jac = [t .* exp(-p(4)*t) ...
                  -exp(-p(4)*t) + exp(-p(5)*t) ...
                  -exp(-p(4)*t) + exp(-p(6)*t) ...
                  -t .* (p(1)*t - p(2) - p(3)) .* exp(-p(4)*t) ...
                  -t * p(2) .* exp(-p(5)*t) ...
                  -t * p(3) .* exp(-p(6)*t)];
       end
   end
return
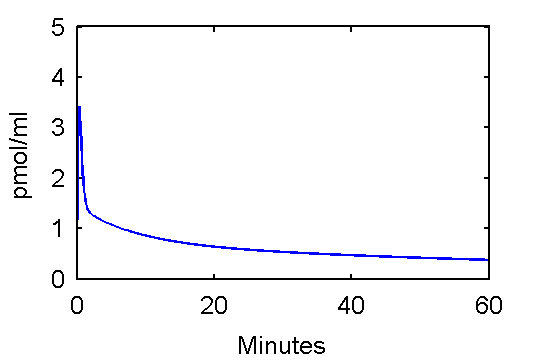
This function can be used to plot an example input curve using these commands
   t=0:.1:60;
   pin = [28 0.75 0.70 4.134 0.1191 0.01043];
   plot(t,refCp(pin,t))
   set(gca,'FontSize',6);
   axis([0 60 0 5]);
   xlabel('Minutes');
   ylabel('pmol/ml');
Note that he above function, refCp.m not only calculates values Cp, it also optionally calculates values for the derivative of Cp with respect to parameter vector p. These will be needed later since to fit the input function, it is important to quantify how changes in values of p will effects Cp values which, in turn, effect model-predicted tissue concentration reflected in voxels or regions of interest.
Step 2 Create an FDG model
   cm = compartmentModel;

   %        k1     k2      k3     k4
   ktrue=[0.1020 0.1300 0.0620 0.0068];

   % define the parameters
   cm = addParameter(cm, 'k1',    ktrue(1));     % 1/min
   cm = addParameter(cm, 'k2',    ktrue(2));     % 1/min
   cm = addParameter(cm, 'k3',    ktrue(3));     % ml/(pmol*min)
   cm = addParameter(cm, 'k4',    ktrue(4));     % 1/min
   cm = addParameter(cm, 'sa',    75);           % specific activity of injection, kBq/pmol
   cm = addParameter(cm, 'dk',    log(2)/109.8); % radioactive decay
   cm = addParameter(cm, 'PV',    1);            % (none)

   % define input function parameter vector
   cm = addParameter(cm, 'pin', [28; 0.75; 0.70; 4.134; 0.1191; 0.01043]);

   % define compartments
   cm = addCompartment(cm, 'Ce',);
   cm = addCompartment(cm, 'Cm');
   cm = addCompartment(cm, 'Junk');

   % define plasma input function
   % specifying function as refCp with parameters pin
   cm = addInput(cm, 'Cp', 'sa', 'dk', 'refCp', 'pin'); % plamsa pmol/ml

   % connect inputs and compartments
   cm = addLink(cm, 'L', 'Cp', 'Ce', 'k1');
   cm = addLink(cm, 'K', 'Ce', 'Junk', 'k2');
   cm = addLink(cm, 'K', 'Ce', 'Cm', 'k3');
   cm = addLink(cm, 'K', 'Cm', 'Ce', 'k4');

   % specify scan begin and end times
   ttt=[ ones(6,1)*5/60; ...    %  6 frames x  5   sec
         ones(2,1)*15/60; ...   %  2 frames x 15   sec
         ones(6,1)*0.5;...      %  6 frames x  0.5 min
         ones(3,1)*2;...        %  3 frames x  2   min
         ones(2,1)*5;...        %  2 frames x  5   min
         ones(10,1)*10];        % 10 frames x 10   min
   scant = [[0;cumsum(ttt(1:(length(ttt)-1)))] cumsum(ttt)];
   cm = set(cm, 'ScanTime', scant);

   % define an output which is sum of Ce and Cm adjusted to account
   % for partial volume (PV).  Ignore vascular activity.
   Wlist = {...
       'Ce', 'PV';
       'Cm', 'PV'};
   Xlist = {};
   cm = addOutput(cm, 'PET', Wlist, Xlist);

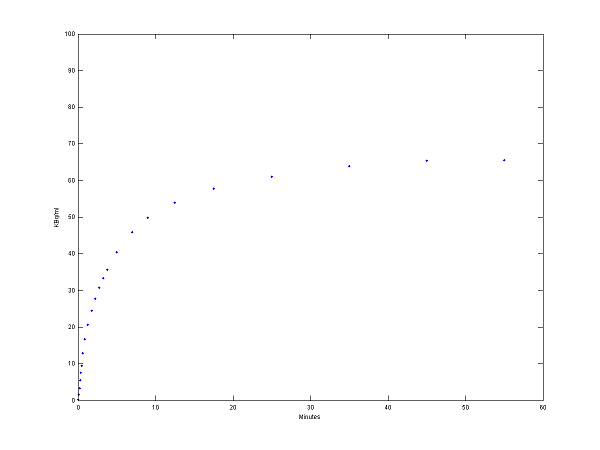
   % solve model and generate example output
   [PET, PETindex]=solve(cm);
   plot(0.5*(PET(:,1)+PET(:,2)),PET(:,3), '.');
   set(gca,'FontSize',6);
   axis([0 60 0 100])
   xlabel('Minutes');
   ylabel('KBq/ml');
Step 3 Use model output as perfect "data"
data = PET(:,3);
Step 4 Fit the "data"
   % tell model abbout data to be fit
   cm = set(cm, 'ExperimentalData', data);

   % specify parameters to be adjusted in fitting
   cm = addSensitivity(cm, 'pin');

   % set parameter values initial guess, lower and upper bounds
   pinit = [ 10; 0.4;  0.4;  3;  0.05; 0.01];
   plb =   [ 10; 0.1;  0.1;  1;  0.05; 0.001];
   pub =   [100; 2. ;  2. ; 10;  1.  ; 0.05];

   % actually do the fitting
   pfit = fit(cm, pinit, plb, pub);
Values of parameter pfit estimates are [28.0167; 0.7652; 0.7059; 4.1586; 0.1257; 0.0105] and are reasonably close to the true values (pxEval(cm, 'pin')) [28; 0.75; 0.70; 4.134; 0.1191; 0.01043]
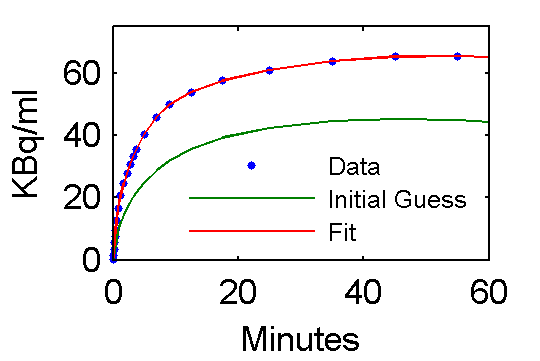
Step 5 Examine model outputs for "data", initial guess, and fit
   PETfit = solve(set(cm, 'ParameterValue', 'pin', pfit));
   PETinit = solve(set(cm, 'ParameterValue', 'pin', pinit));
   t = 0.5*(PET(:,1)+PET(:,2));
   plot(t,data,'.', t, PETinit(:,3), t, PETfit(:,3));
   set(gca,'FontSize',8);
   axis([0 60 0 75])
   xlabel('Minutes');
   ylabel('KBq/ml');
   ah=legend('Data', 'Initial Guess', 'Fit','Location','SouthEast');
   set(ah,'FontSize',6,'Box','off');


