Support:Documents:Manual:COMKAT GUI
General use of COMKAT
Data Requirements to COMKAT GUI
To use COMKAT GUI, there are some minimum requirements to the file formats and content of the data. Please read the following carefully before you use the GUI.
Input Function
Input functions have to be read from files that meet these requirements:
- Each file MUST contain both the time and activity information.
- Time: The measuring time of the sample.
- Activity: Activity measured at the measuring time of the sample.
- Time and activity has to be stored as columns that are of the same length and in the correct order.* A sample activity measured at certain time must be on the same row as the measuring time.
- Each column containing data must be continuous. Space between lines will cause errors. Text between numeric data might cause errors as well. (See example files: Correct format, bad file example 1, bad file example 2, bad file example 3)
- For different types of files, some extension-specific requirements may apply. (See below for those requirements)
- COMKAT allows you to load the input function from several different files. See Input Function GUI for instructions to load the input function.
- File formats supported include:
| File Type | Specific requirement |
|---|---|
| Text files (txt) | x |
| Comma separated files (csv) | x |
| MATLAB files (mat) | The time and activity must be stored in the same variable. One .mat file may contain more than one variable, even nested. |
| Excel files (xls) | The time and activity must be stored in the same worksheet. But the file can contain multiple worksheets. |
| Blood activity monitor (BAM) files (bam) | The unit of activity in the BAM file has to be in counts and the counter sensitivity must be stored in the header |
- Units supported include:
| Type | Unit |
|---|---|
| Time | Second, minute, hour |
| Activity | milli Ci, micro Ci, nano Ci, Bq, MBq, counts (if counter sensitivity is provided) |
Output Function
Output functions can be either loaded from files or images.
Image requirements
You can use the COMKAT Image Tool to draw ROIs or VOIs and extract time-activity curves from PET images. It also supports image fusion between PET and CT images. Image formats supported include:
| Vendor | Specific requirement | Models we have tested |
| Siemens | - | ECAT Exact® |
| Philips | - | Allegro® |
| Siemens Concorde MicroPET | You must have both the .img and .hdr files for the emission scan. | MicroPET P4® |
| DICOM | We currently support DICOM PET and DICOM CT images. You can load both dynamic (recommended) and static PET images. | - |
(Can't find your format in this list? We are happy to provide assistence for you to write functions to load your images in COMKAT. Contact Dean Fang or Raymond Muzic for instructions to make your image reading function compatible to COMKAT.)
File requirements
- Each file MUST contain both the time and activity concentration information.
- Time: The output time can be saved as frame beginning time, frame endding time, frame duration or mid-time points as one column. (Either format is compatible) It can also be saved as two-column frame beginning and ending time.
- Activity concentration: The data must be in the format of activity/volume. See below for supported units.
- Time and activity has to be stored as columns that are of the same length and in the correct order.
- The activity concentration measured or imaged at certain time must be on the same row as the measuring time.
- Each column containing data must be continuous. Space between lines will cause errors. Text between numeric data might cause errors as well. (See example files: Correct format, bad file example 1, bad file example 2, bad file example 3)
- For different types of files, some extension-specific requirements may apply. (See below for those requirements)
- If you want to load multiple ROIs at the same time, all TACs have to stored in the same file.
- File formats supported are exactly the same as the input function files
Overview of COMKAT GUI
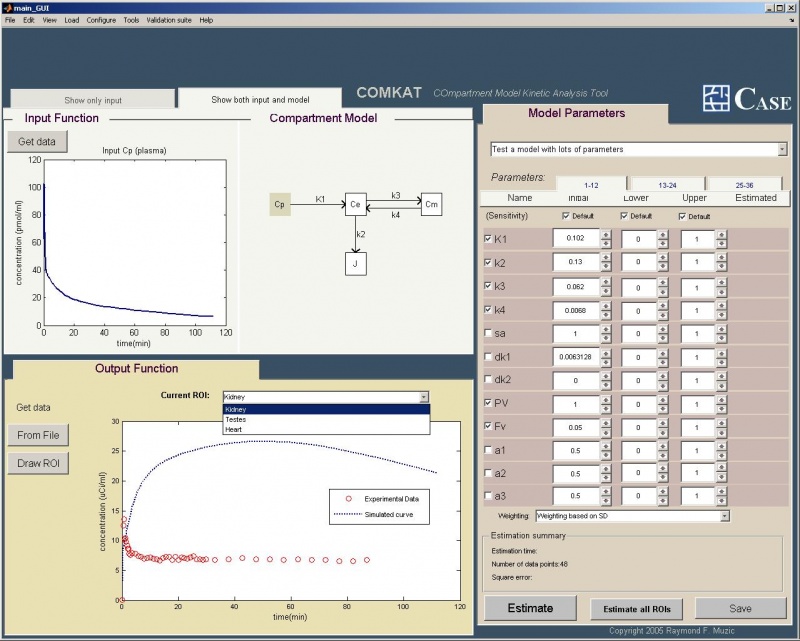
Here is how COMKAT GUI looks when you open it:
It is divided into four panels:
- The "Input Function" panel: it shows the curve of the input function.
- The "Output Function" panel: it shows the curve of the output function, including the experimental, simulated and fitted curves if existing.
- The "Compartment Model" panel: it shows the diagram of the model.
- The "Model Parameters" panel: it shows the details of parameters used in the current model.
COMKAT GUI has been developed that it can fit all kinds of screen resolutions without being distorted.
Starting COMKAT GUI
There are several ways to start the COMKAT GUI:
- Go to Matlab command window. Type "comkat" or "main_GUI" and COMKAT GUI should be started. OR
- Open the Matlab editor and open the file "main_GUI.m". Press F5 or select "Debug"->"Run". OR
- Open the Matlab editor and open the file "main_GUI.m". Press F5 or select "Debug"->"Run". OR
- Select "Run COMKAT GUI" from the COMKAT welcome window. OR
- If you are using a windows systems, you may start comkat by running "comkat_GUI.bat", which is located under folder "comkat_GUI", by double clicking it. (You may create a shortcut for it, too.)
Loading input data
To load the input data into COMKAT GUI, press the "Get data" button on "Input Function" panel.
A window for loading the input function will show up as below:
Refer to Document: COMKAT Input Function for using the Input Function GUI.
Loading output data
There are two ways to load the output data:
- From files.
- From ROIs (on the images.)
Load the output data from files
Click on the "From File" button. A window will be poped up to ask you to select the file. COMKAT GUI supports following file types of data:
- Excel files (*.xls)
- Text files (*.txt)
- Comma separated files (*.csv)
- Matlab data file (*.mat)
After selecting the file, a GUI will pop up to guide you through the output loading.
With this GUI, you can:
- View data and select the columns
- Different worksheets (excel files) or variables (mat files) can be viewed
- Assign units to time and concentration data
- Preview the output data in the plot
- Load multiple ROIs and assign name to each ROI
Before you proceed, please note the following requirements:
- For the output data, COMKAT GUI requires the file to contain information of both time and concentration.
- Each set of data must be stored as columns, not rows.
- Time can be stored as:
- Frame beginning time
- Frame endding time
- Frame mid-time point
- Frame duration (COMKAT is going to assume that the study begins at time=0 and there is no gap before frames.)
- The starting and ending row of data must be the same for each column.
How to execute the function:
| File type | Function | How |
| General | Decide how the time is stored | Click on the popup menu of "Time stored as" |
| Name ROIs | Click on the "Data" column to enter ROI name | |
| Adjust units | Click on the popup menu of "Unit" | |
| Select data column | Click on the popup menu of "Column" | |
| Change rows of starting and ending | Click on the "First row of data" and "Last row of data" to enter row number. | |
| Load multiple ROI data | Click "Add ROI" button, select the column | |
| Finish loading data and return to main GUI | Click "OK" to exit and return main GUI | |
| Return to main GUI without loading the data | Click "Cancel" to exit and return main GUI | |
| Excel files | Switch to a different excel worksheet | Click on the worksheet in the list box of "Excel worksheet" |
| .mat | Swtich to a different variable | Click on the worksheet in the list box of "Matlab variable " |
Following default information can be set in the preference of COMKAT:
- Default time and concentration unit
- Default file format
- Default time stored format
- Default time column
Please refer to the "Preference setting" section for those settings.
Future version of COMKAT GUI will support the function to let the user write their own code to load the output data. Load the output data from ROIs.
Click on the "Draw ROI " button. The COMKAT image tool will be started to let you draw the ROI. Please refer to the "COMKAT image tool" section for the use of it.
After finishing drawing ROIs, click "Return to main GUI". Successful data loading
If you loaded your data successfully, the GUI should look like the image below. If you have more than one ROI, you can use the popupmenu "Current ROI:" to switch between ROIs. If there is only one ROI, this popupmenu will disappear.
Loading a COMKAT project
File-> Load project and select the COMKAT project file you saved before.
Selecting a model
To select the model, click the popup menu "Select a model from templates". OR
Click "Load"->"Compartment model". You may load the compartment model there within templates, .m files or .mat files.
Simulate model output
Once you load the model, COMKAT GUI automatically simulates the model output as long as you have your input function defined (either default or user-defined.) It is shown as a blue dotted line.
If you have multiple ROIs, you can set different initial guesses for different ROIs. For each ROI the model output will be simulated individually based on the intial guess of this ROI.
Every time you change an initial guess for a parameter, COMKAT GUI automatically computes the model output and refresh the plot.
Parameter estimation
Before you estimate the model parameters, you must make sure you have loaded the output function (experiment data) and the model. If you have an default input function in the model template, you can estimate the parameters without loading your own input function.
To estimate the current ROI, press "Estimate" button; to estimate all ROIs, press "Estimate all ROIs".
Settings for parameter estimation include:
- Parameter initial guess
- Parameter upper and lower bounds
- Parameter sensitivity (whether you want to estimate or fix the parameter value)
To adjust these values, click in the edit box of them and modify the values. You may also click on the arrows points upward and downward next to the value to increase or decrease the value by 10%. You can try to generate a model output that is close to the experimental output. This combination of initial guess may be more appropriate for parameter estimation.
The checkbox of "Default" lets you reset the parameter values back to the ones defined in the model template.
Here is the look of the GUI after you estimate the parameters successfully:
- Estimated values will be listed
- Estimated output will be plotted
- Estimation summary (square error and time consumed) will be listed.

