Difference between revisions of "Support:Documents:Examples:K-Means and Fuzzy C-Means analysis"
Jump to navigation
Jump to search
| Line 1: | Line 1: | ||
=K-Means and Fuzzy C-Means= | =K-Means and Fuzzy C-Means= | ||
| − | In COMKAT R4.0a, you can analyze images by K-Means or Fuzzy C-Means. | + | In COMKAT R4.0a, you can analyze images by K-Means or Fuzzy C-Means clustering. |
| − | 1.Image > Clustering | + | 1.Select Image > Clustering |
[[Image:K_Fuzzy_Means_1.png]] | [[Image:K_Fuzzy_Means_1.png]] | ||
| Line 13: | Line 13: | ||
| − | 3.If you select Fuzzy C-means, you can | + | 3.If you select Fuzzy C-means, you can output Labels or Probability Maps /membership functions : |
[[Image:K_Fuzzy_Means_3.png]] | [[Image:K_Fuzzy_Means_3.png]] | ||
| − | 4. | + | 4.Assign number of clusters |
[[Image:K_Fuzzy_Means_4.png]] | [[Image:K_Fuzzy_Means_4.png]] | ||
| − | 5.If your images are several MR contrast (muti-bands), you can also analyze | + | 5.If your images are several MR contrast (muti-bands), you can also analyze band-2 and band-3 by unchecking the checkbox as follows: |
| − | [[Image: | + | [[Image:K_Fuzzy_Means_12.png]] |
| Line 41: | Line 41: | ||
</pre> | </pre> | ||
| − | 2.Colormap > GreenFire | + | 2.Select Colormap > GreenFire |
[[Image:K_Fuzzy_Means_6.png]] | [[Image:K_Fuzzy_Means_6.png]] | ||
| − | 3.Image > Clustering | + | 3.Select Image > Clustering |
[[Image:K_Fuzzy_Means_7.png]] | [[Image:K_Fuzzy_Means_7.png]] | ||
| Line 57: | Line 57: | ||
5.Results | 5.Results | ||
| − | [[Image: | + | [[Image:K_Fuzzy_Means_11.png]] |
Revision as of 18:41, 3 August 2015
K-Means and Fuzzy C-Means
In COMKAT R4.0a, you can analyze images by K-Means or Fuzzy C-Means clustering.
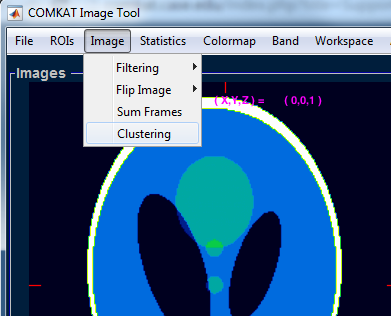
1.Select Image > Clustering
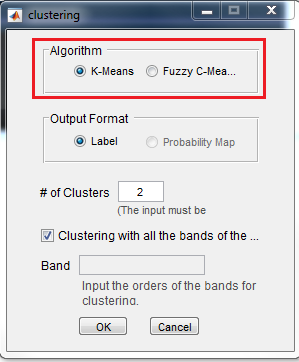
2.You can select K-Means or Fuzzy C-Means here:
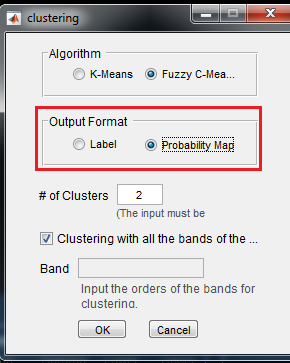
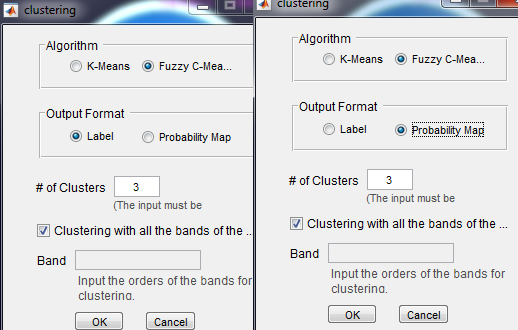
3.If you select Fuzzy C-means, you can output Labels or Probability Maps /membership functions :
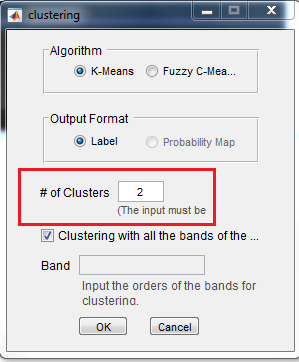
4.Assign number of clusters
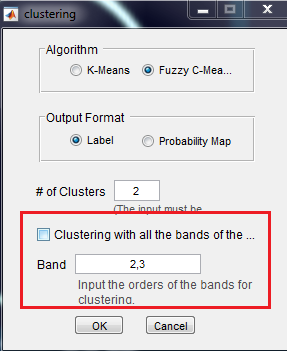
5.If your images are several MR contrast (muti-bands), you can also analyze band-2 and band-3 by unchecking the checkbox as follows:
Examples
Here we use Fuzzy C-means for an example.
1.Load phantom imge:
a= phantom(256);
b= phantom(256);
c= cat(3,a,b);           % COMKAT do not read 2-D image
comkatimagetool(c)
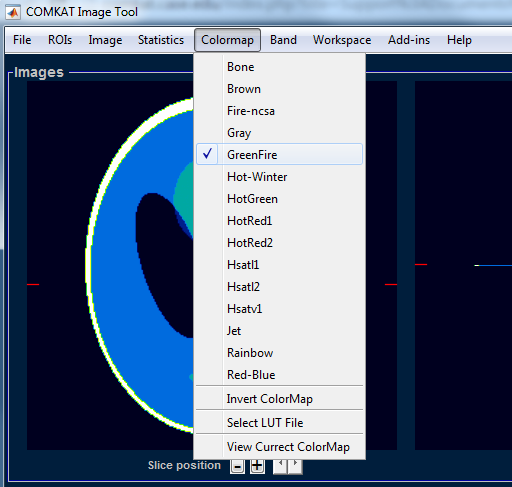
2.Select Colormap > GreenFire
3.Select Image > Clustering
4.Set as follows:
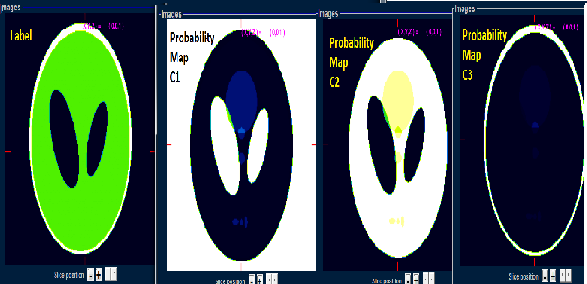
5.Results

