Difference between revisions of "Support:Documents:Manual:COMKAT Input Function"
| (9 intermediate revisions by 3 users not shown) | |||
| Line 9: | Line 9: | ||
=== Simulation=== | === Simulation=== | ||
| + | <br> | ||
| + | ==== Types of functions: Feng Input, Gamma3, User defined spline ==== | ||
| + | The input function represents the arterial whole blood activity <span class="plainlinks">[http://www.makecrepes.net<span style="color:black;font-weight:normal; text-decoration:none!important; background:none!important; text-decoration:none;">measured during the course</span>] of an experiment. Whole blood activity can be defined either using a simlation tool or by using an experimental data file. In this section we define the whole blood activity using the simulation tool, for this we use the section named Input function. We start by first selecting the type of function which could either be Feng input, Gamma3 or a User defined spline. | ||
| + | ===== Feng Input ===== | ||
| + | Whole blood activity is simulated using the feng input model which is given by the following equation | ||
| + | <br><br>[[Image:Feng-1.JPG|400px|]] | ||
| − | ==== | + | ===== Gamma3===== |
| − | + | Whole blood activity is simulated using the gamma3 model which is given by the following equation | |
| + | <br><br>[[Image:Feng-2.JPG|400px|]] | ||
| − | ===== | + | =====User define spline===== |
| − | + | User defined spline can be used in two ways | |
| + | |||
| + | #Load an input function defined in a piecewise polynomial form: <br> If the user has a variable defined in a piecewise polynomial (ppval) form (example: if the user uses commands like "SPLINE" or "LSPLINE" then this creates a variable with a ppval form) and if it contains necessary information about whole blood activity then this feature of User defined spline can be used to load that data into COMKAT. It is however important to note that the user should create the variable having the ppval form before he selects the feature of user defined spline, and also the variable should be created in the command window of Matlab (Note: The workspace should have its stack with the option "Base" selected while creating the variable in command window). A variable with a ppval form can be created in the command window of Matlab by typing the following commands: <br><br> x = 0:8; <br>y = [0 .15 1.12 2.36 2.36 1.46 .49 .06 0]; <br>cs = spline(x,[0 y 0]);<br> This creates a variable by the name "cs" in the command window which has a ppval form<br><br> ppnew=spline(0:.1:100,sin(0:.1:100));<br><br> Similary the above command creates a variable by the name "ppnew" in the command window having a ppval form. Also note that the input function in COMKAT assumes that the default units for concentration are "micro-curie/ml" and that of time are "minutes", hence while creating an input function do create in terms of these default units.When the user selects the feature of user defined spline, the following pop up window appears <br><br>[[Image:User-defined-spline-1.JPG|400px|]]<br><br>If the variable with a ppval form has already been created then click on the drop down menu, select it and then press OK to see the output as a plot. If the variable hasn't been created then press Cancel and create the variable in the command window first.<br><br>[[Image:User-defined-spline-2.JPG|400px|]]<br><br> | ||
| + | # Load an input function from a previous project: <br> The user can also load a saved variable with a ppval form representing an input function from a previous project. For details on how to save a variable with a ppval form refer to the section of Save. As an example to load a variable into the command window let us consider a variable by the name "Parameters.mat" which has the saved parameters for the input function in a ppval form and which is saved in the folder by name "C:\Examples". Let us first load the variable into the command window by writing the following command <br><br> y = load('C:\Examples\Parameters.mat'); <br><br> With this the details of the input function are loaded into the variable 'y' and this variable can be seen in the drop down menu of the spline parameter window from where it can be loaded. | ||
| + | |||
| + | ==== Parameters: Values ==== | ||
| + | Depending upon the function selected the user can modify the appropriate parameters for that particular function using the button Values, this would also modify the plot. | ||
| + | As discussed in the previous section input function representing the artertial whole blood activity can be defined using a simulation tool which has the simulation functions feng input, gamma3 or a user defined spline. In this section we discuss the parameters of each simulation function. These parameters are accessed using the button Values. | ||
| + | |||
| + | ===== Feng input ===== | ||
| + | If the selected function is feng input then on selecting Values the following window appears<br><br>[[Image:Parameters-Values-1.jpg]] | ||
Latest revision as of 00:15, 30 January 2012
The input function toolbox starts with whole blood activity page. To see which page you are currently on look at the section of Steps which is present on the lower left hand side corner of the toolbox, where the current active page is highlighted. The toolbox starts by first defining the Whole blood acitivty followed by Metabolites (Ligand in plasma fraction) and then finally the Result verification page. The following paragraphs define the possible usage and the implementation of each of the above mentioned sections in detail.
1. Whole blood activity
To define the whole blood activity make sure the section of Steps which is present on the lower left hand side corner of the toolbox has the text Whole blood activity highlighted (by default the toolbox starts from the whole blood activity page), if not use the arrow keys to get to the whole blood activity page. The input function represents the arterial whole blood activity measured during the course of an experiment. Whole blood activity can be defined either using a simlation tool or by using an experimental data file. Simulation tool uses functions like feng input and gamma3 to simulate the whole blood activity whereas experimental data file shows the activity measured using a blood activity monitor (BAM) or manual samples.
Let us first define the whole blood activity using the simulation tool for which we use the section named Input function.
Simulation
Types of functions: Feng Input, Gamma3, User defined spline
The input function represents the arterial whole blood activity measured during the course of an experiment. Whole blood activity can be defined either using a simlation tool or by using an experimental data file. In this section we define the whole blood activity using the simulation tool, for this we use the section named Input function. We start by first selecting the type of function which could either be Feng input, Gamma3 or a User defined spline.
Feng Input
Whole blood activity is simulated using the feng input model which is given by the following equation

Gamma3
Whole blood activity is simulated using the gamma3 model which is given by the following equation

User define spline
User defined spline can be used in two ways
- Load an input function defined in a piecewise polynomial form:
If the user has a variable defined in a piecewise polynomial (ppval) form (example: if the user uses commands like "SPLINE" or "LSPLINE" then this creates a variable with a ppval form) and if it contains necessary information about whole blood activity then this feature of User defined spline can be used to load that data into COMKAT. It is however important to note that the user should create the variable having the ppval form before he selects the feature of user defined spline, and also the variable should be created in the command window of Matlab (Note: The workspace should have its stack with the option "Base" selected while creating the variable in command window). A variable with a ppval form can be created in the command window of Matlab by typing the following commands:
x = 0:8;
y = [0 .15 1.12 2.36 2.36 1.46 .49 .06 0];
cs = spline(x,[0 y 0]);
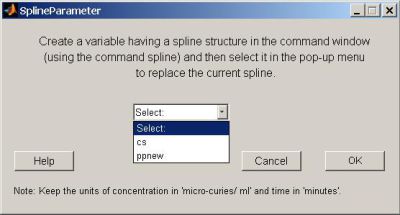
This creates a variable by the name "cs" in the command window which has a ppval form
ppnew=spline(0:.1:100,sin(0:.1:100));
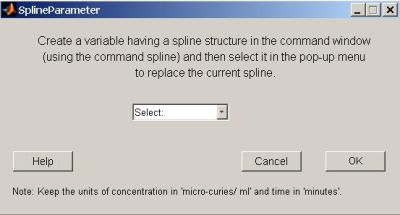
Similary the above command creates a variable by the name "ppnew" in the command window having a ppval form. Also note that the input function in COMKAT assumes that the default units for concentration are "micro-curie/ml" and that of time are "minutes", hence while creating an input function do create in terms of these default units.When the user selects the feature of user defined spline, the following pop up window appears
If the variable with a ppval form has already been created then click on the drop down menu, select it and then press OK to see the output as a plot. If the variable hasn't been created then press Cancel and create the variable in the command window first. - Load an input function from a previous project:
The user can also load a saved variable with a ppval form representing an input function from a previous project. For details on how to save a variable with a ppval form refer to the section of Save. As an example to load a variable into the command window let us consider a variable by the name "Parameters.mat" which has the saved parameters for the input function in a ppval form and which is saved in the folder by name "C:\Examples". Let us first load the variable into the command window by writing the following command
y = load('C:\Examples\Parameters.mat');
With this the details of the input function are loaded into the variable 'y' and this variable can be seen in the drop down menu of the spline parameter window from where it can be loaded.
Parameters: Values
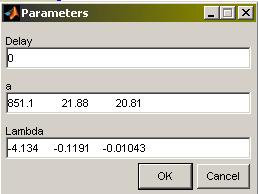
Depending upon the function selected the user can modify the appropriate parameters for that particular function using the button Values, this would also modify the plot. As discussed in the previous section input function representing the artertial whole blood activity can be defined using a simulation tool which has the simulation functions feng input, gamma3 or a user defined spline. In this section we discuss the parameters of each simulation function. These parameters are accessed using the button Values.
Feng input
If the selected function is feng input then on selecting Values the following window appears

